
performance analysis. One common method for doing this is by configuring a SPAN (Switched Port Analyzer) or monitor session on a Cisco switch. This technique allows us to copy traffic from one or more ports and send it to a destination port, where a packet capture tool can analyze the packets.
In this blog post, we’ll walk through the steps to configure a monitor session for both source and destination ports and capture packets using Cisco Packet Tracer.
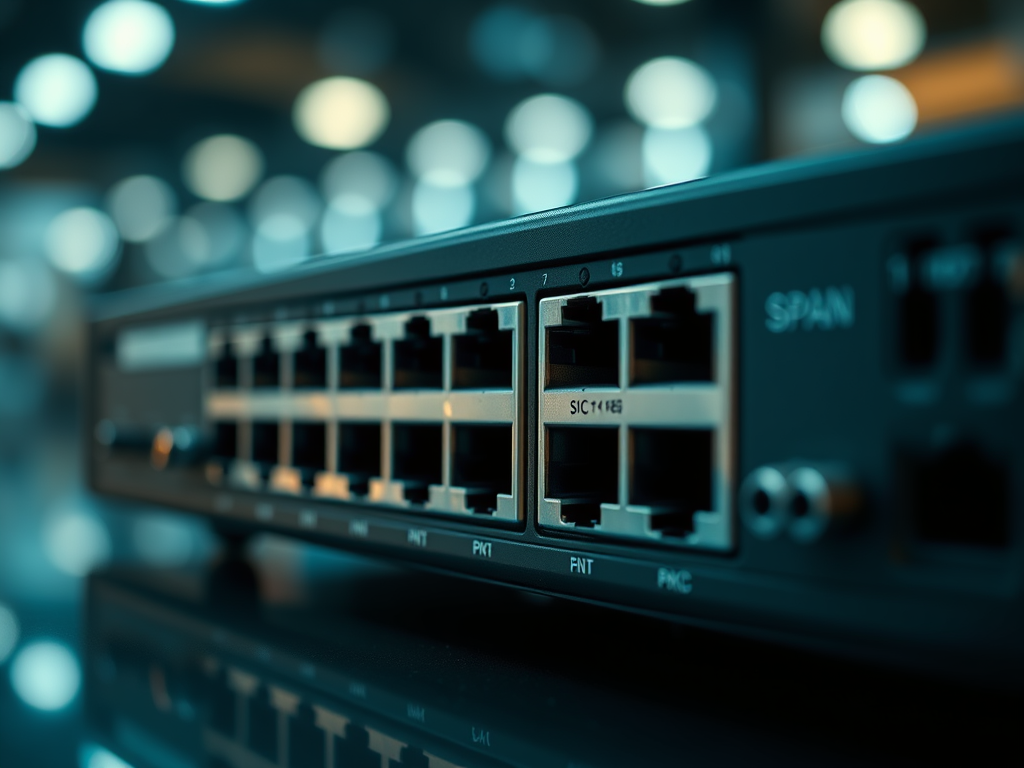
What is SPAN?
SPAN is a feature used to mirror traffic from a source port (or VLAN) to a destination port on a Cisco switch. The destination port is connected to a monitoring device (such as a PC running Wireshark) for packet capture.
SPAN Types
- Local SPAN: Traffic is mirrored to a port on the same switch.
- Remote SPAN (RSPAN): Traffic is mirrored to a port on another switch using a special VLAN.
Steps to Configure Monitor Session in Cisco Switch and Capture Packets
1. Network Setup
Let’s assume we have a simple network topology with the following devices:
- Cisco Switch (Switch 0)
- PC 1: Connected to Port
FastEthernet0/1(source port) - PC 2: Connected to Port
FastEthernet0/2(destination port for monitoring)
2. Configure the Source Port
In this case, PC 1 is connected to FastEthernet0/1 and we want to monitor all traffic going through this port. We’ll configure this as the source for the SPAN session.
Switch(config)# monitor session 1 source interface fastEthernet 0/1
Here’s what this command does:
monitor session 1creates a new monitor session with the ID1.source interface fastEthernet 0/1tells the switch to mirror traffic from the portFastEthernet0/1.
3. Configure the Destination Port
Now, let’s configure FastEthernet0/2 as the destination port, where we’ll connect the monitoring device (PC 2). This PC will capture the mirrored traffic.
Switch(config)# monitor session 1 destination interface fastEthernet 0/2
This command directs the mirrored traffic to FastEthernet0/2, where the monitoring device is connected.
4. Verify the Configuration
After configuring both the source and destination ports, you can verify the SPAN session configuration with the following command:
Switch# show monitor session 1
This will display the session details, confirming that FastEthernet0/1 is the source port and FastEthernet0/2 is the destination.
5. Capture Traffic Using Wireshark
Now that the SPAN session is configured, we can use Wireshark to capture the mirrored traffic. Follow these steps to do so:
Step 1: Install and Launch Wireshark
- If you haven’t already, download and install Wireshark from here.
- Open Wireshark on PC 2, which is connected to the destination port (
FastEthernet0/2).
Step 2: Start Capturing Packets
- In Wireshark, select the network interface corresponding to the NIC on PC 2.
- Click the Start button to begin capturing traffic.
Step 3: Generate Network Traffic
- To capture some traffic, you can initiate a ping or any other network activity from PC 1 (connected to the source port). For example:
PC1> ping 192.168.1.10
Full Example Configuration
Here’s a sample configuration summary:
Switch# configure terminal
Switch(config)# monitor session 1 source interface fastEthernet 0/1
Switch(config)# monitor session 1 destination interface fastEthernet 0/2
Switch(config)# end
Switch# show monitor session 1
Important Considerations
- Performance Impact: Be aware that SPAN sessions can impact switch performance, especially if you’re mirroring high-volume traffic.
- Bidirectional Monitoring: If you want to monitor both inbound and outbound traffic, ensure your SPAN configuration captures both directions using the
bothkeyword.
Switch(config)# monitor session 1 source interface fastEthernet 0/1 both